A well-built page that took 34 seconds to finish
Start with what nasa.gov does right, because it rules out most of the usual advice before we begin.
Sixteen of the eighteen external scripts on this page carry defer. There are three
stylesheets on the whole homepage, 37 KB together. Forty-five of the seventy images carry
width, height and a srcset; thirty-two carry loading="lazy"; the hero image carries
fetchpriority="high". Three fonts are preloaded, no more. This is not a page anyone was
careless with.
Its largest element on mobile finishes drawing at 34.0 seconds.
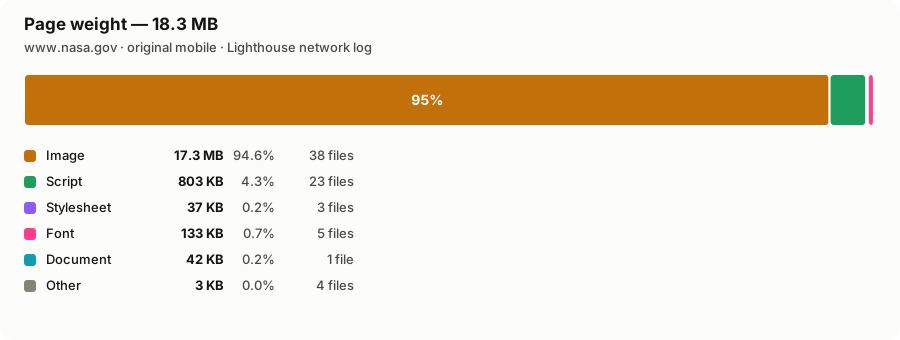
18.3 MB, and 94.6% of it is images
The resource inventory from the mobile run:
| Type | Requests | Bytes |
|---|---|---|
| Images | 38 | 17.3 MB |
| Scripts | 23 | 803 KB |
| Fonts | 5 | 133 KB |
| Document | 1 | 42 KB |
| Stylesheets | 3 | 37 KB |
| Total | 76 | 18.3 MB |
You could delete every stylesheet on nasa.gov and a visitor on a phone would not notice the download finish sooner. That is worth stating plainly, because “minify your CSS” is the advice this page would get from almost any automated report.
Four requests, 12.8 megabytes
Sort those 38 images by size and the page stops being complicated:
| File | Bytes | Format |
|---|---|---|
| GiantSequoias.png | 6,002,945 | PNG |
| Milky Way_Bill Dunford.png | 3,765,416 | PNG |
| GiantSequoias.png (again) | 2,093,432 | PNG |
| Milky Way_Bill Dunford.png (again) | 958,985 | PNG |
| …the other 34 images | 4,318,006 | mixed |
Two photographs. Four requests. 12.8 MB — 67% of the page.
Each appears twice because each is used twice: once as a card illustration, once as a decorative background in a different section. The two references are written differently:
<!-- the card: asks the image service for a width -->
<img src="https://assets.science.nasa.gov/dynamicimage/…/Milky%20Way_Bill%20Dunford.png?w=1024"
     alt="What's Up: July 2026 Skywatching Tips from NASA" class="hds-media-background z-100" />

<!-- the decorative background: asks for whatever the service has -->
<img decoding="async" loading="lazy" alt=""
     style="transform: scale(1); object-position: 50% 50%; object-fit: cover;"
     src="https://assets.science.nasa.gov/dynamicimage/…/Milky%20Way_Bill%20Dunford.png">
Same picture, two URLs, so the browser fetches both. And the second one has no size parameter, so the service returns the master file.
The fix is already built, and already used 56 times on this page
assets.science.nasa.gov/dynamicimage/ is a resizing service. Most of the page uses it
correctly — 56 of the 70 img tags carry a ?w= parameter. We asked the live service for the
same file three ways:
$ curl -sI 'https://assets.science.nasa.gov/dynamicimage/…/GiantSequoias.png'
content-type: image/png        →  6,002,123 bytes

$ curl -sI '…/GiantSequoias.png?w=1024'
content-type: image/png        →  2,092,610 bytes

$ curl -sI '…/GiantSequoias.png?w=480'
content-type: image/png        →    470,297 bytes
12.8× smaller, for a query string. The Milky Way file behaves the same way: 3,764,594
plain, 958,164 at w=1024, 239,913 at w=480 — 15.7×.
Both are photographs delivered as PNG, which is the second half of the bill. And the service
returns PNG no matter what the client asks for: requesting either file with
Accept: image/avif,image/webp,image/png returns content-type: image/png, byte for byte the
same response. One server-side setting would apply to every page on every NASA property that
uses this service.
What the proxy could and could not do
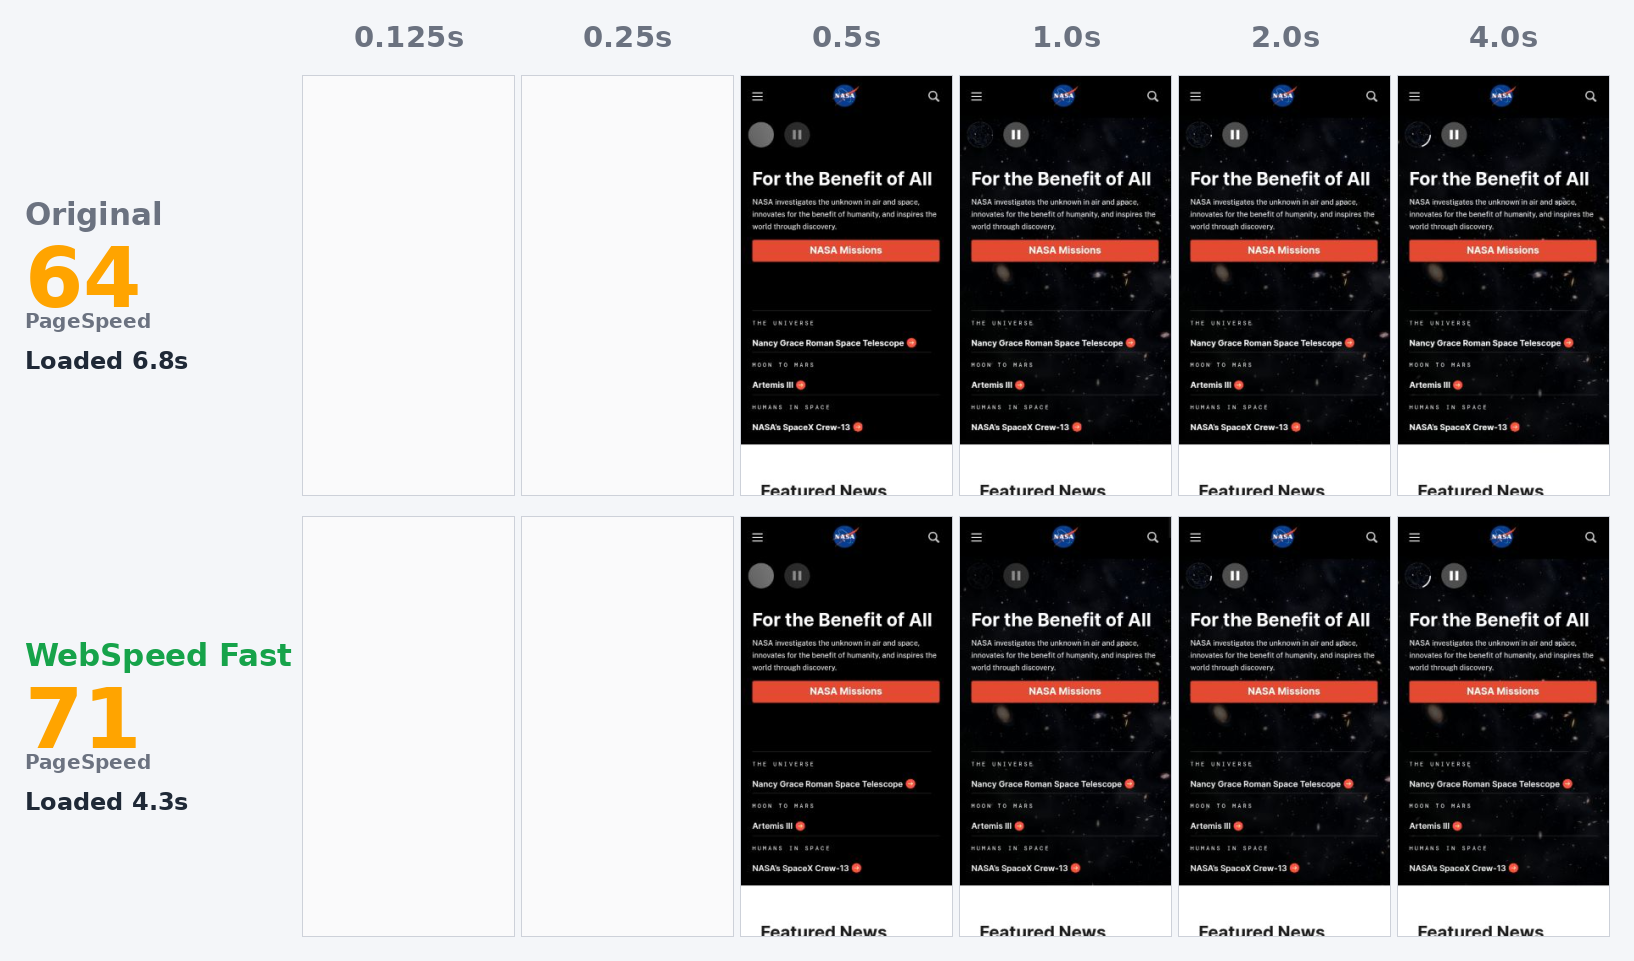
Through WebSpeed the same page scores 71 on mobile instead of 64, and its largest element lands at 9.2 s instead of 34.0.
| Metric (mobile) | Original | Through WebSpeed |
|---|---|---|
| PageSpeed score | 64 | 71 |
| First Contentful Paint | 1.7 s | 2.0 s |
| Speed Index | 6.8 s | 4.3 s |
| Largest Contentful Paint | 34.0 s | 9.2 s |
| Time to Interactive | 34.6 s | 13.3 s |
| Total Blocking Time | 220 ms | 30 ms |
| Cumulative Layout Shift | 0 | 0 |
What the filter log did, in order of how much it mattered: lazy-loaded everything below the
first screen, preloaded the hero image with fetchpriority="high", moved eighteen body scripts
behind first interaction, converted twenty-two unsized images to real aspect ratios, inlined
two small stylesheets (10.8 KB → 2.7 KB gzipped) and the font CSS with font-display: swap.
Now the honest part. The two photographs are still there. 9.8 MB of PNG still downloads through the proxy — 76% of everything that remains — because our transcoder refuses sources over 5 MiB and the largest file here is 6.0 MB. The cap exists to protect our own memory, and on this page it means the single image most worth converting is the one we skip. A proxy can change the order bytes arrive in and it can stop below-fold images from competing with the hero. It cannot decide on your behalf that a 6 MB master file should not be on the homepage.
That is why the score moved seven points while LCP moved twenty-five seconds. Arrival order is what a proxy owns. Weight is what the site owns.
Why this is not a WordPress problem
It would be easy to file this under “WordPress is heavy”. The measurement says the opposite. The WordPress part of this page — the theme, the blocks, the plugin CSS — is 37 KB of stylesheets, 803 KB of scripts, sixteen of eighteen of them deferred. That is a tighter budget than most hand-built marketing pages we measure.
What no CMS can do is stop one component from writing an image URL without a size parameter. Thirty-one images on this page are decorative backgrounds; eleven of them omit the parameter that the other fifty-six use. From inside the editor, all thirty-one look identical — you pick a picture and it appears. This is the shape platform performance problems almost always take, and it is why they respond to auditing the component rather than to auditing the site.
Fix it yourself
None of this needs us. It needs someone to do it, test that nothing broke, and do it again after the next template change — which is the part we sell.
- Ask your own resizer for the size you actually display The two heavy images come from assets.science.nasa.gov/dynamicimage/, a service that resizes on request — most of the page already uses it that way. These two are requested with no parameter at all, so it returns the master file. Measured on the live service: 6,002,123 bytes plain, 2,092,610 at w=1024, 470,297 at w=480. The fix is a query string that already works, on a component that already knows how to write one.
- Do not request the same photograph twice on one page Both of these files appear in two places — once as a card illustration with a size parameter, once as a decorative background without one. The browser has no way to know they are the same picture, because the URLs differ, so it downloads both. Together the four requests are 12.8 MB of an 18.3 MB page.
- Photographs are not PNG A photograph of giant sequoias has no flat colour and no transparency to preserve, which is everything PNG is good at. The same service returns JPEG for most of the site's imagery; these two files are the exception, and the container alone is worth several megabytes before any resizing.
- Let the image service answer Accept: image/webp Requesting either file with an Accept header advertising WebP and AVIF returns content-type image/png, byte for byte identical. Content negotiation is a server-side setting that changes nothing in the markup and applies to every page that uses the service, not just this one.
- Audit the component, not the page 31 images on this page are decorative "media background" elements, and 11 of them carry no size parameter. That is the shape of most platform performance problems: not a site built carelessly, but one component that omits something the other 56 images include.
What we measured, and what got worse
PageSpeed Insights (Lighthouse, mobile and desktop) run against the live site
and against the same page served through the WebSpeed proxy, on
22 Jul 2026. Audit a696e9d135784a — the numbers
on this page are frozen at that run and are not restated later.
We re-ran the same audit on 19 Aug 2026 and got 73 → 66 on mobile, 78 → 94 on desktop. The teardown below is not rewritten around those numbers: it describes the page as it was measured, and the figures in the text belong to that run. NASA has since rebuilt this page: the same audit now measures 7.5 MB where it measured 18.3, and the two 6 MB photographs this teardown is about are gone. On the page that replaced it our proxy no longer wins on mobile — 73 without us against 66 with us, a seven-point loss — while desktop improved from 78 to 94. We are leaving the July measurement and its findings as they were published rather than restating them around a different page.
Proxy response re-checked on 22 Jul 2026: the proxied URL returns the page itself, not a redirect back to the origin. That check exists because a redirect makes both halves of a before/after the same page, and the improvement pure noise.
What the page still loaded
The accelerated run made 51 requests against the original's 76, and transferred 12.3 MB against 18.3 MB. We print this because a score can rise for two very different reasons — the page got faster, or the page got less of itself — and across our audit base the second is common enough to be worth ruling out in the open.
What got worse or stayed the same
- The PageSpeed score on a page this heavy is noisy, and we would rather print the spread than a lucky draw. Five paired runs on the day of measurement gave mobile originals of 57–72 against accelerated runs of 68–83; the frozen pair above is 64 → 71. What does not move between runs is the shape: LCP was better every single time, and total blocking time never got worse.
- The accelerated run made 51 requests against 76, and that difference is lazy-loading of what sits below the first screen, not content that failed to arrive. We publish the number because the two are indistinguishable from a score — the filmstrip below is how you check, and both rows show the same page at every frame.
- We did not fix the actual problem. 9.8 MB of PNG still ships through the proxy — 76% of what remains — because our image transcoder refuses sources over 5 MiB, and the biggest file on this page is 6.0 MB. The cap protects our own memory; on this page it means the one image most worth converting is the one we skip. Only the site can fix these two URLs.
- Desktop CLS moved from 0 to 0.012. Far inside the "good" threshold, but the move is ours: lazy-loading and asynchronous CSS change when elements get their final size.
- One page, one run, one day. This is a teardown, not a study — nothing here generalises to WordPress sites as a class, and the study that does try to generalise is linked below.